MACD Indicator: What It Is, How It Works and Where It Falls Short
 Published Oct 22, 2026
 Updated Oct 22, 2026
The MACD indicator turns the gap between a short-term and a long-term moving average into a momentum reading that plots below the price chart. Traders track how that reading moves against its own average and against a zero baseline. This article covers the formula, how crossovers and the zero line are interpreted, and the market conditions where readings become unreliable.
Key Takeaways
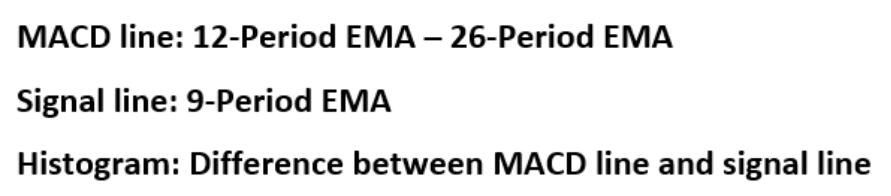
- The MACD indicator measures the relationship between two exponential moving averages. The MACD line is the 12-period EMA minus the 26-period EMA, and the signal line is a 9-period EMA of the MACD line.
- The histogram plots the difference between the MACD line and the signal line.
- Traders read MACD through signal line crossovers, zero line crossovers and the size of the histogram, which they interpret as bullish or bearish momentum.
- MACD tends to work best in trending markets and can produce misleading crossovers in range-bound markets.
- MACD is built from past prices and does not predict future moves. Any position based on a MACD reading can lose money.
What is MACD?
The Moving Average Convergence Divergence (MACD) is a technical indicator which simply measures the relationship of exponential moving averages (EMA).
The MACD displays a MACD line (blue), signal line (red) and a histogram (green) - showing the difference between the MACD line and the signal line.

The MACD line is the difference between two exponentially levelled moving averages – usually 12 and 26-periods, whilst the signal line is generally a 9-period exponentially smoothed average of the MACD line.
These MACD lines waver in and around the zero line. This gives the MACD the characteristics of an oscillator giving overbought and oversold signals above and below the zero-line respectively.
What Does the MACD Indicator Measure?
The MACD measures momentum or trend strength by using the MACD line and zero line as reference points:
- When the MACD line crosses ABOVE the zero line, this signals an UPTREND
- When the MACD line crosses BELOW the zero line, this signals an DOWNTREND
In addition, the MACD signals buy or sell orders wgich are given when the two MACD lines cross over as outlined below:
- When the MACD line crosses ABOVE the signal line, traders use this as a BUY indication
- When the MACD line crosses BELOW the signal line, traders use this as a SELL indication

How is MACD calculated?
Most charting platforms offer the MACD indicator, and implement this calculation using the aforementioned default periods.
The formula below breaks down the varying components of the MACD to make it comprehensible for traders to apply.
MACD formula calculation
As mentioned previously, the MACD histogram plots the difference between the two moving average lines. The histogram fluctuates in and around the zero designation on the MACD indicator.
When the MACD line is above the signal line, then the histogram will be positive. The opposite is true when the MACD line sits below the signal, whereby the histogram will plot below the zero as a negative value. A zero value on the histogram indicates a crossing over of the two moving average lines thus marking buy/sell signals.
What are the Limitations of the MACD Indicator?
The MACD indicator is considered to work best in trending markets. This limits its use for traders depending on their trading strategies. For example, range bound/consolidating markets will generally give flawed signals when using the MACD. Traders will need to truly understand the MACD as well as when to employ the indicator for optimal use. Novice traders may find this indicator difficult to use initially, which is why going through basic moving average and EMA fundamentals will benefit traders who are looking to make use of the MACD indicator.
The variations that can be implemented with the MACD indicator is almost infinite which makes it very personal to the trader. This subjective nature of the MACD will mean that results differ from trader to trader which take away any consistency. Traders will need to follow a basic outline when using the MACD:
- Selecting EMA parameters
- Using an appropriate time frame, as MACD may function differently across time frames
How to Use the MACD Indicator on the tastytrade Platform
Here’s how to find and add the MACD indicator to your charts on the tastytrade platform.
Once you have located the symbol you want to research make sure you are in the “Chart” tab under “Trade Mode".

Next, navigate to the “Indicators” icon, which is the 4th icon in the row. When you hover over the icon, it will say “Indicators”.
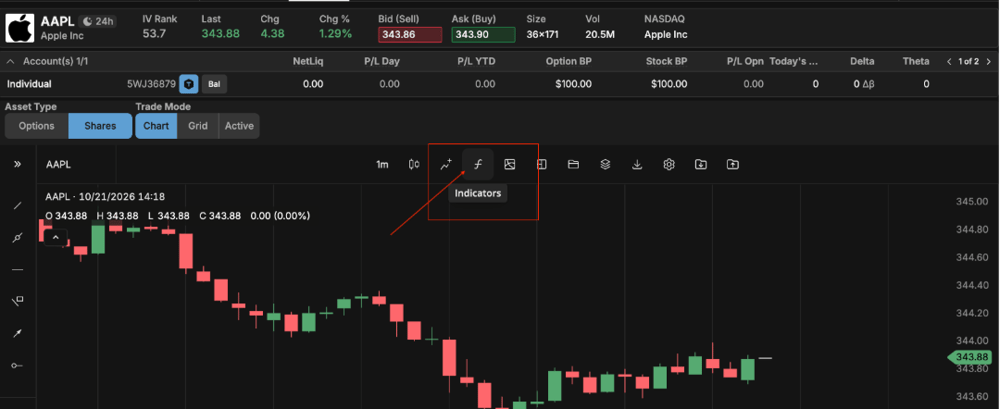
Click on the Indicators icon and a “Edit Indicators” window will pop up.
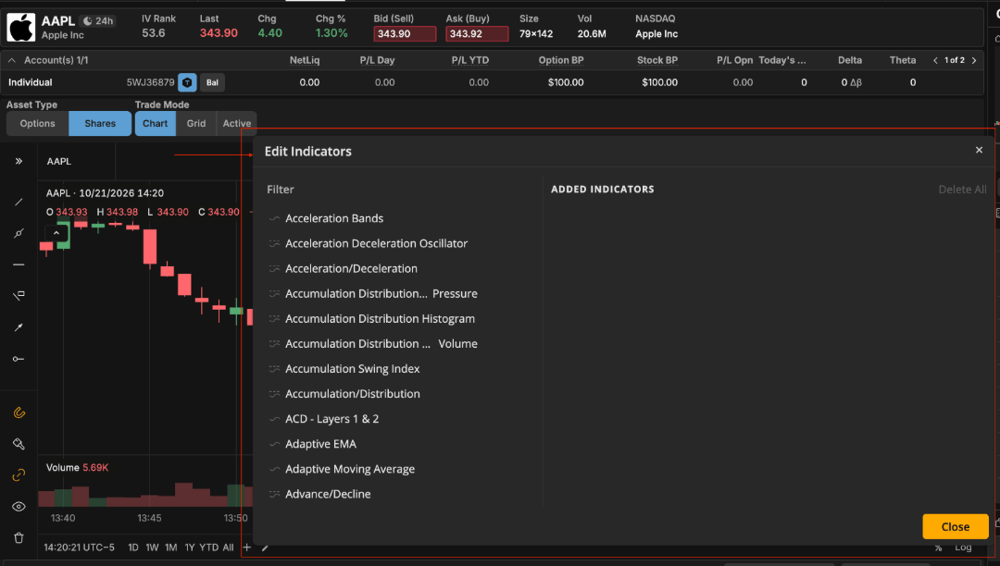
In the Edit Indicators window you can now search for the indicator you want to add. In this case we will search for MACD. As you can see, there are multiple MACD indicators that you can choose from, but since we spoke about the “two lines” indicator in this article, we will choose that one.

Once you find the indicator you want, just double click on the name and you will see it populate on the right side of the Edit Indicators popup box. Depending on the indicator and how big your screen is you might also be able to see your trading dashboard change behind the popup window.
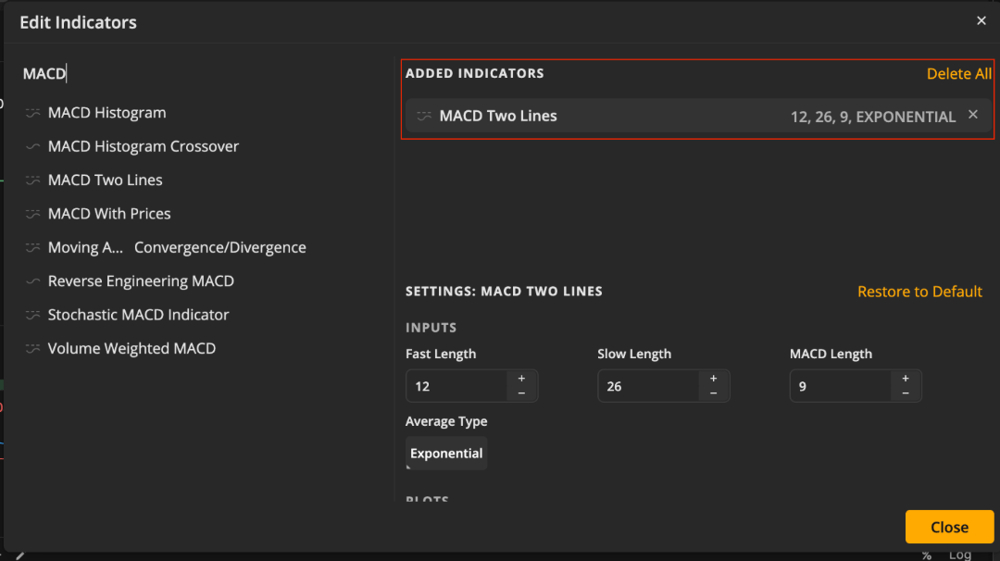
Below the “Added Indicators” list, you will also see options for you to edit the setting for your MACD indicator.
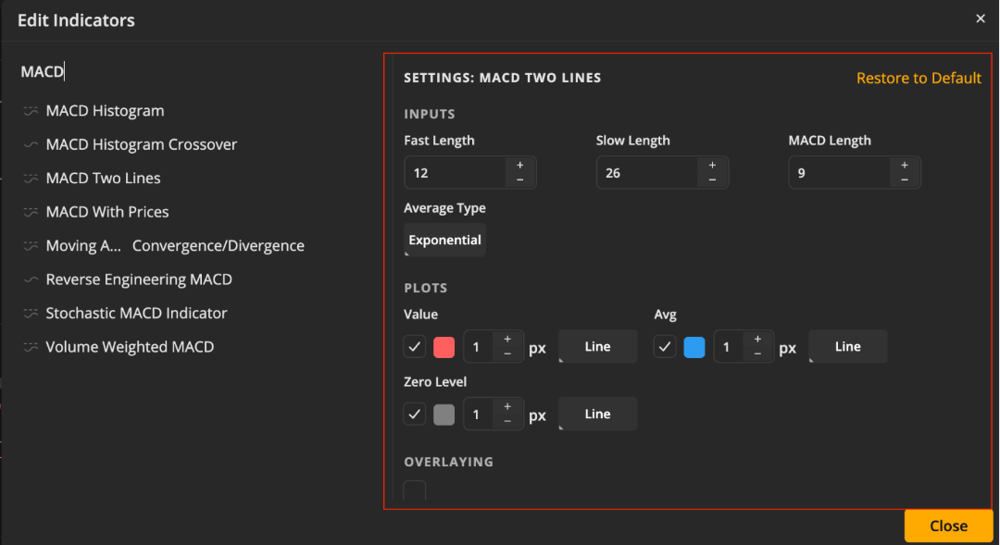
Once the settings are to your liking, just hit “Close” and you will be taking back to your chart where you should see the MACD Two Lines indicator!
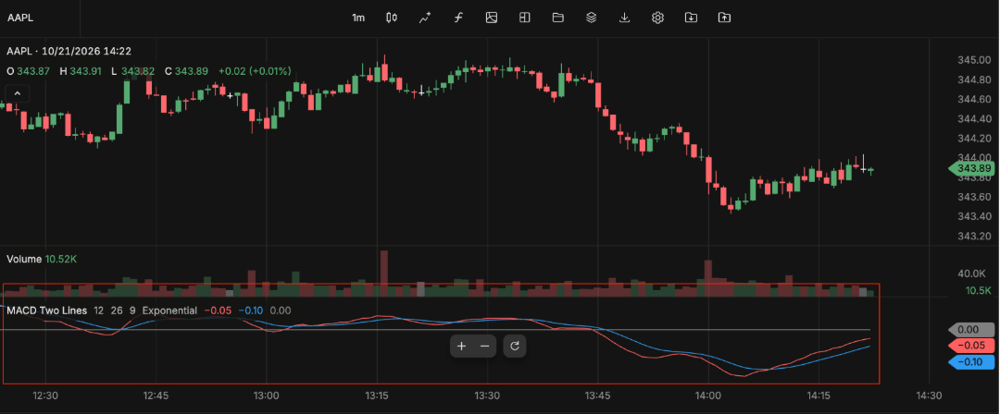
If you want a closer look at how the MACD works on the symbols you follow, open a tastytrade account and use the tool yourself!
The Key Takeaway for MACD Indicator
The MACD is unique in that it serves as an oscillator as well as MACD crossover indicator. This dual purpose gives two signals in one indicator allowing for a less cluttered chart. Traders may find this useful which makes understanding the MACD worthwhile.
Frequently Asked Questions
Traders look at where the MACD line sits relative to the signal line and the zero line. A cross above the signal line is generally read as bullish momentum, and a cross below as bearish. The histogram shows the gap between the two lines.
No MACD value is inherently good or bad. MACD is unbounded and depends on the price and volatility of the instrument, so traders focus on direction and the relationship between the lines rather than a specific number.
Traders use MACD to evaluate trend direction and momentum through signal line crossovers, zero line crossovers and divergence from price. MACD can give misleading crossovers in range-bound markets, and it does not predict future moves.
This content, including the use of actual symbols, any visual display or other reference to product, type of investment, strategy, or service offered, is for educational and informational purposes only. It is not, nor is intended to be, trading or investment advice or a recommendation that any investment product or strategy is suitable for any person.