Implied Volatility (IV) Rank: What It Is and How to Use It
 Published Oct 21, 2026
 Updated Oct 22, 2026
Implied Volatility Rank (IV) Rank measures where current implied volatility sits compared to its highest and lowest levels over the past year, helping traders evaluate option premiums and select strategies.
- IV rank ranges from 0 to 100, with higher readings indicating elevated implied volatility compared to the past 52 weeks.
- Traders often consider selling options when IV rank is high and buying options when IV rank is low.
- IV rank does not predict market direction or future volatility, but it provides useful context when evaluating potential trades.
What Is Implied Volatility Rank?
Implied Volatility Rank, or IV rank, compares an underlying's current implied volatility to its highest and lowest readings over the past 52 weeks. It helps traders understand whether options are relatively expensive or inexpensive compared to their recent history.

For example, a stock with 30% implied volatility might have relatively expensive options if its normal volatility is around 15%. Another stock with the same 30% implied volatility might have relatively inexpensive options if its typical volatility is closer to 50%.
IV rank makes these comparisons easier by measuring each underlying against its own historical range rather than comparing different stocks directly.
How Is IV Rank Calculated?
IV rank measures the distance between current implied volatility and its lowest reading over the past year, divided by the total range between the yearly high and low.
IV Rank = (Current IV − Lowest IV) / (Highest IV − Lowest IV) × 100
For example, consider a stock with a yearly implied volatility low of 20%, a high of 60% and a current reading of 35%.
The IV Rank calculation formula would look like this:
IV Rank = (35− 20) / (60 − 20) × 100
Measurement | Value |
|---|---|
Lowest IV | 20% |
Highest IV | 60% |
Current IV | 35% |
IV Rank | 37.5 |
Measurement | Value |
|---|---|
Lowest IV | 20% |
Highest IV | 60% |
Current IV | 35% |
IV Rank | 37.5 |
The stock has an IV rank of 37.5 because current implied volatility sits 37.5% of the way between its yearly low and high.
A reading of 0 means implied volatility is at its yearly low, while a reading of 100 means it is at its yearly high. The formula assumes the yearly high and low are different.
What Do High and Low IV Rank Readings Mean?
IV rank readings help traders identify whether the current volatility environment is relatively high or low compared to the past year.
A high IV rank means options are relatively expensive compared to their historical levels, but that does not mean they are necessarily overpriced.
Similarly, a low IV rank suggests option premiums are relatively inexpensive, but volatility can remain low for extended periods.
These ranges are general guidelines rather than fixed rules.
IV Rank | Volatility Environment |
|---|---|
0 to 25 | Low implied volatility |
25 to 50 | Relatively low to moderate volatility |
50 to 75 | Moderate to elevated volatility |
75 to 100 | High implied volatility |
IV Rank | Volatility Environment |
|---|---|
0 to 25 | Low implied volatility |
25 to 50 | Relatively low to moderate volatility |
50 to 75 | Moderate to elevated volatility |
75 to 100 | High implied volatility |
What Is the Difference Between IV Rank and IV Percentile?
IV rank and IV percentile both compare current implied volatility to historical readings, but they use different calculations.
- IV rank measures where current volatility falls between its yearly high and low.
- IV percentile measures the percentage of trading days over the past year when implied volatility was lower than its current level.
For example, imagine a stock normally trades between 20% and 30% implied volatility but briefly spikes to 80% during a major market event.
If current implied volatility is 30%, IV rank would be approximately 17 because the unusually high reading stretches the yearly range.
However, if implied volatility was below 30% on 230 of the previous 252 trading days, IV percentile would be approximately 91.
Metric | Reading |
|---|---|
IV Rank | 17 |
IV Percentile | 91 |
Metric | Reading |
|---|---|
IV Rank | 17 |
IV Percentile | 91 |
Both readings are correct. IV rank shows where volatility sits within its yearly range, while IV percentile shows how often volatility has been lower.
This distinction is important because a single large volatility spike can affect IV rank for an entire year, even after volatility returns to more normal levels.
How Do Traders Use High IV Rank to Sell Options?
When IV rank is elevated, option premiums tend to be larger because the market is pricing in greater expected movement. Traders may consider selling options to collect these higher premiums.
Common strategies include:
- short puts
- short or covered calls
- credit spreads
- iron condors
- and short strangles
Selling premium generally benefits when option values decline. However, higher premiums come with additional risk because elevated implied volatility often reflects greater uncertainty about future price movements.
A high IV rank does not guarantee that volatility will decrease.
Implied volatility can continue rising, and large price movements can create substantial losses for short option positions.
How Do Traders Use Low IV Rank to Buy Options?
When IV rank is low, option premiums may be relatively inexpensive compared to their historical levels. Traders may consider purchasing options when they expect a directional move or an increase in implied volatility.
Common strategies include:
- long calls
- long puts
- debit spreads
- and calendar spreads
Buying options can benefit from an increase in implied volatility, but traders must still account for time decay and price movement.
Low IV rank does not guarantee that volatility will rise. If implied volatility remains low or the underlying moves against the position, long options can lose value, including the entire premium paid.
What Does a Trade Using High IV Rank Look Like?
Consider a hypothetical stock trading at $100 with an IV rank of 80. A trader expects the stock to remain above $95 and decides to sell a put credit spread with 45 days until expiration.
The trader sells the $95 put for $1.80 and buys the $90 put for $0.80, collecting a net credit of $1.00.
Trade Metric | Value |
|---|---|
Stock Price | $100 |
IV Rank | 80 |
Spread Width | $5 |
Credit Received | $100 |
Maximum Profit | $100 |
Maximum Loss | $400 |
Breakeven at Expiration | $94 |
Trade Metric | Value |
|---|---|
Stock Price | $100 |
IV Rank | 80 |
Spread Width | $5 |
Credit Received | $100 |
Maximum Profit | $100 |
Maximum Loss | $400 |
Breakeven at Expiration | $94 |
If the stock remains above $95 at expiration, the trader keeps the full $100 credit. If the stock falls below $90, the spread reaches its maximum loss of $400.
The elevated IV rank provides context for why the trader might consider selling premium, but the potential profitability still depends on price movement, volatility and trade management.
What IV Rank Does Not Tell Traders
IV rank provides useful information about historical volatility, but it does not measure whether an options trade will be profitable.
It also does not predict whether a stock will rise or fall.
Implied volatility can increase during both market rallies and selloffs, and a high reading does not automatically mean volatility will decline.
Earnings announcements and major economic events can also temporarily increase implied volatility. These changes may reflect real uncertainty rather than unusually attractive option premiums.
Traders should consider IV rank alongside historical volatility, upcoming events, strike selection, expiration and overall position risk.
Using IV Rank on tastytrade
Traders can use IV rank on tastytrade to evaluate volatility conditions before selecting an options strategy.
Comparing IV rank with IV percentile can provide a better understanding of whether current implied volatility is unusually high or low.
Once the volatility environment is understood, traders can compare option premiums, expirations, probabilities of profit and maximum potential losses before entering a position.
IV rank is most useful when combined with other trading metrics rather than treated as a standalone entry signal.
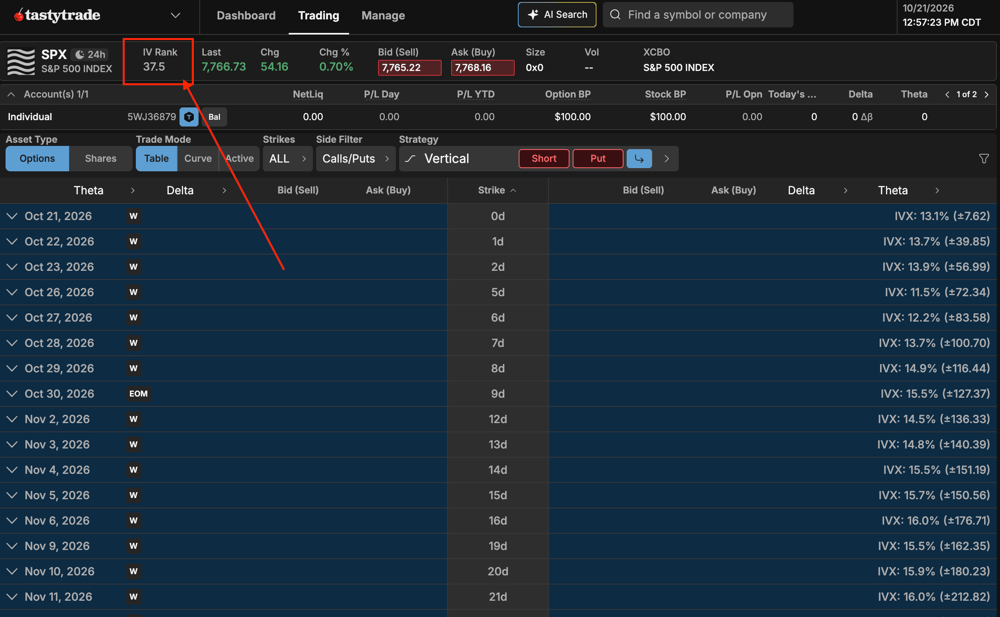
IV rank is displayed next to the price on the main options chain on the platform.
The Practical Rule
IV rank helps traders understand where current implied volatility stands relative to its own history. Higher readings may make premium selling worth evaluating, while lower readings may make premium buying more attractive.
The important distinction is that IV rank measures relative volatility, not future market direction or guaranteed opportunity.
Traders who combine IV rank with IV percentile, expected price movement and defined risk can make more informed decisions about which options strategies fit the current market environment.
Frequently Asked Questions
No single IV rank defines a good level for buying options. One simple convention treats readings below the midpoint of 50 as lower and readings above it as higher. Traders who buy options often look at lower readings, because premiums are relatively inexpensive compared to the past year. A low IV rank does not guarantee that volatility will rise, and long options can lose the entire premium paid.
No. IV rank shows where current implied volatility sits between its yearly high and low. IV percentile shows the percentage of days over the last year that implied volatility traded below the current level. A single volatility spike can stretch the yearly range and lower IV rank, while IV percentile stays high. For example, the same stock can show an IV rank of 17 and an IV percentile of 91.
A high IV rank is neither good nor bad on its own. It means implied volatility is elevated compared to the underlying’s past year, so option premiums are relatively larger. Elevated implied volatility also reflects greater uncertainty, and it can keep rising. Large price moves can create substantial losses for short option positions.
This content, including the use of actual symbols, any visual display or other reference to product, type of investment, strategy, or service offered, is for educational and informational purposes only. It is not, nor is intended to be, trading or investment advice or a recommendation that any investment product or strategy is suitable for any person.